
FUNDAMENTAL OVERVIEW
USD:
The US dollar bounced back this week as US-Iran risks resurfaced after both parties exchanged attacks.
The US launched a series of strikes on Iran in response to Iranian attacks on three vessels in the Strait of Hormuz. Iran retaliated by bombing US bases in Bahrain and Kuwait, warning of further strikes if the US continued.
It was looking like the usual limited escalation we got used to in the past months, but everything changed when Trump said to reporters at the NATO summit in Turkey that the Memorandum of Understanding was over for him and he didn’t want to engage with them anymore.
Oil prices jumped further and inflation worries returned. This triggered a hawkish repricing in interest rate expectations across the board. The chances for a July hike jumped to 34% (was 25% yesterday) and the total tightening by year-end increased to 38 bps (was 30 bps yesterday).
INR:
On the INR side, the Rupee started to fall again in recent weeks as the market focus shifted from oil prices to Fed tightening risks after the last FOMC decision. The tight correlation with oil prices has returned this week following the US-Iran escalation in the Strait of Hormuz.
Today, the Rupee’s slide accelerated as oil prices spiked hard after Trump said that the Memorandum of Understanding with Iran was over for him and he didn’t want to engage with them anymore.
In the big picture, the Indian Rupee remains on a bearish structural trend against the US dollar, so dip-buyers will continue to look for opportunities around strong technical levels to keep pushing the USD/INR pair into new highs.
USDINR TECHNICAL ANALYSIS – DAILY TIMEFRAME
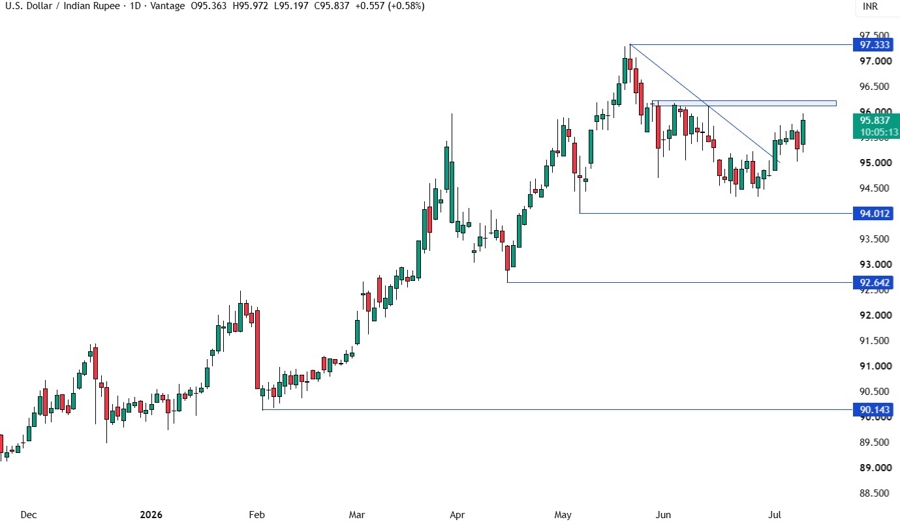
On the daily chart, we can see that USDINR is approaching the first key resistance zone around the 96.10 level. If the price gets there, we can expect the sellers to step in with a defined risk above the resistance to position for a drop back into the 94.00 level. The buyers, on the other hand, will look for a break to increase the bullish bets into the record highs around the 97.33 level.
USDINR TECHNICAL ANALYSIS – 4 HOUR TIMEFRAME
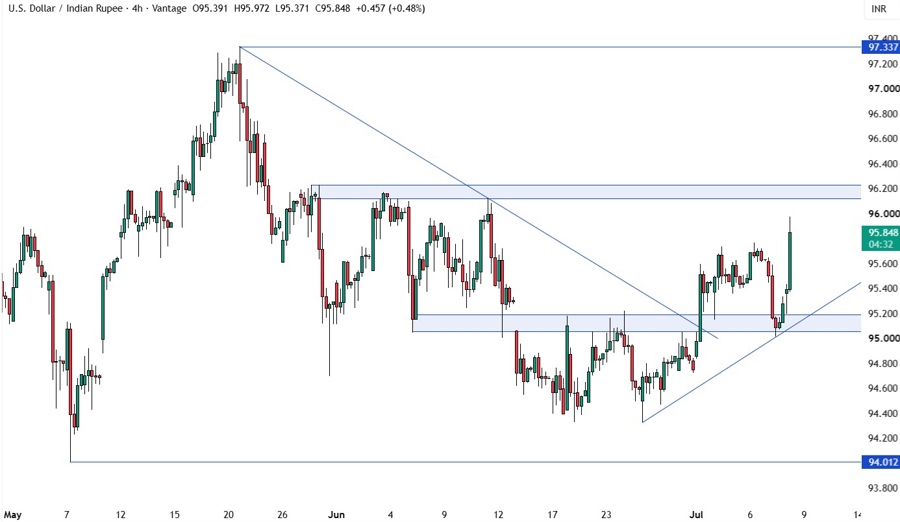
On the 4 hour chart, we can see the price retested the broken resistance turned support around the 95.10 level and rallied into new highs following the US-Iran escalation. We now have an upward trendline defining the bullish structure. If the price falls into the trendline, we can expect the buyers to lean on it with a defined risk below it to keep pushing into new highs. The sellers, on the other hand, will look for a break to pile in for a drop into new lows.
USDINR TECHNICAL ANALYSIS – 1 HOUR TIMEFRAME
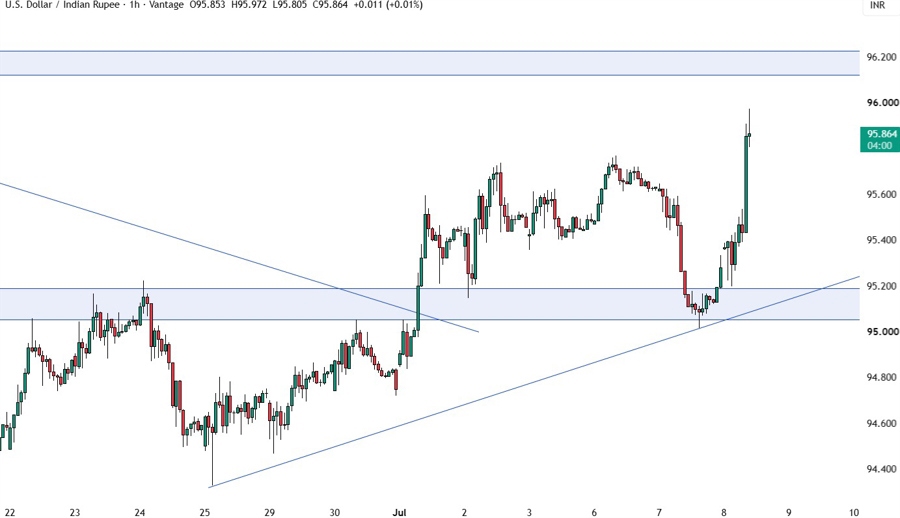
On the 1 hour chart, there’s not much we can add here as the sellers will have a better risk to reward setup around the 96.10 resistance, while the buyers will either wait for a break above the resistance or a pullback into the trendline.
UPCOMING CATALYSTS
Today, we have the FOMC meeting minutes. Tomorrow, we get the latest US Jobless Claims figures.